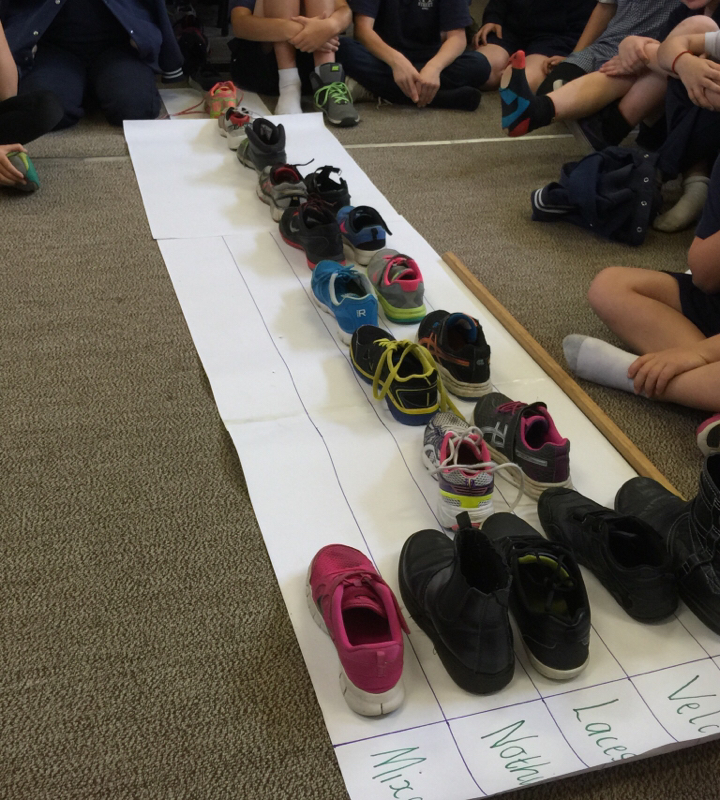
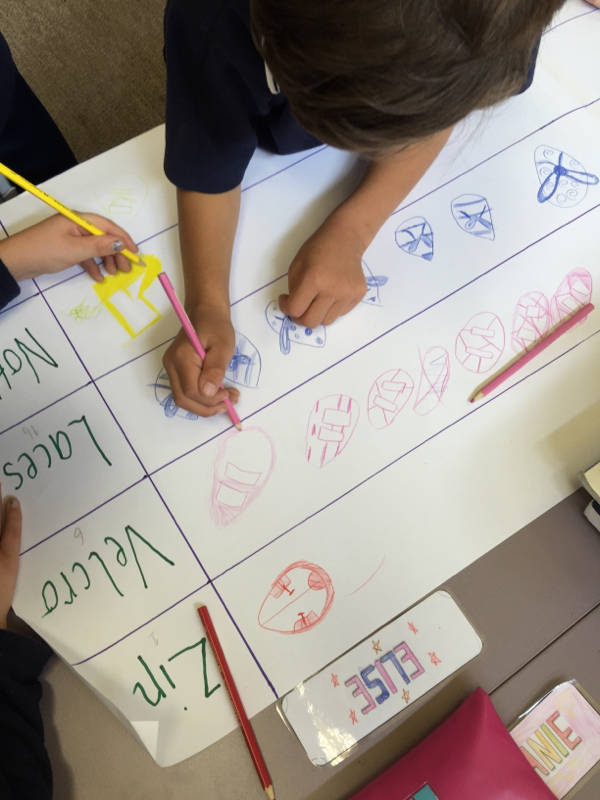
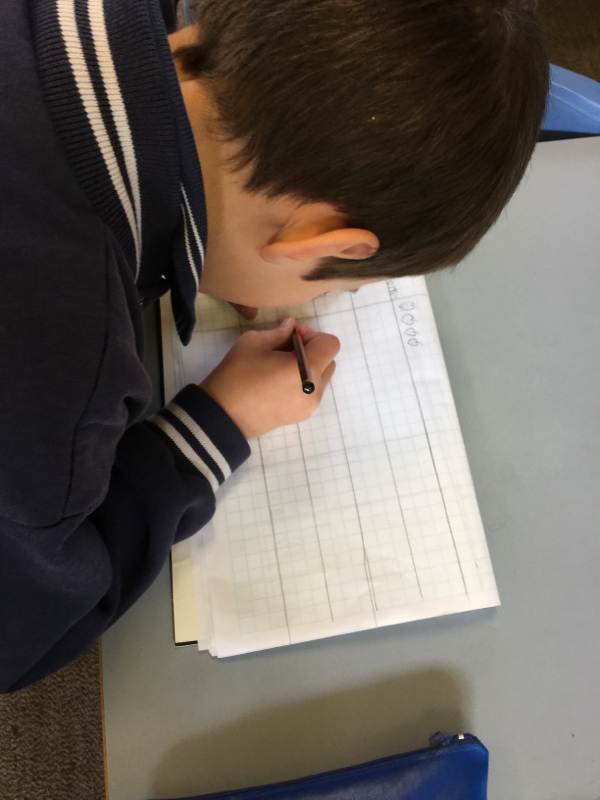
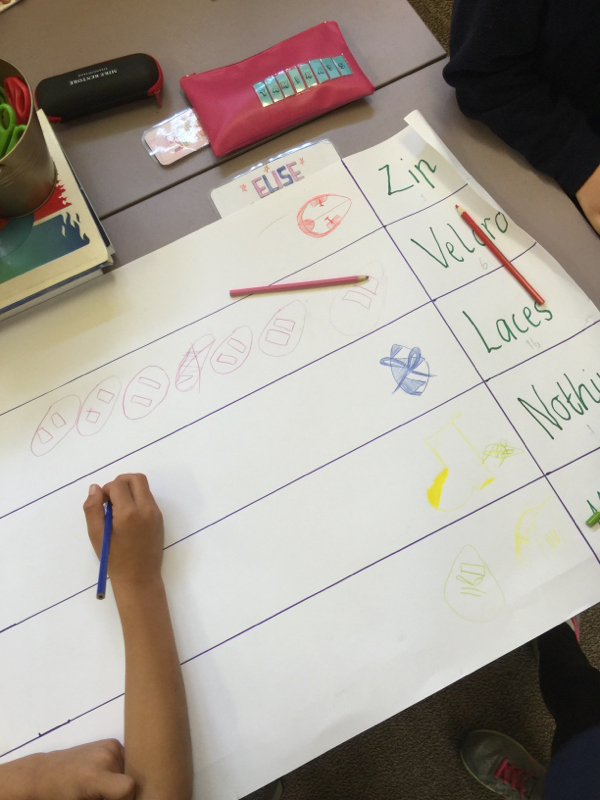
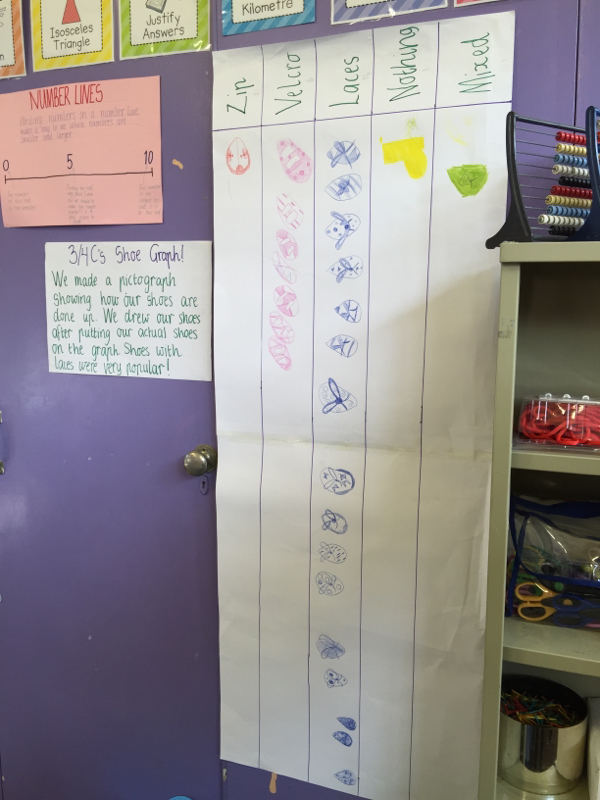
We have started focusing on graphing here in 3/4C. This past week we have started gathering data, learning how to tally information and display our data in different ways. Earlier in the week we made a bar graph that displayed how we all got to school. Today we were making a pictograph. On a big sheet of paper, we drew up our graph together and then categorised our different types of shoes. First we placed them on the sheet, then counted them up and afterwards some special helpers drew our shoes on to the paper. It was very easy to see that laces was the most popular type of shoe in our class once we displayed the data in a pictograph!
 RSS Feed
